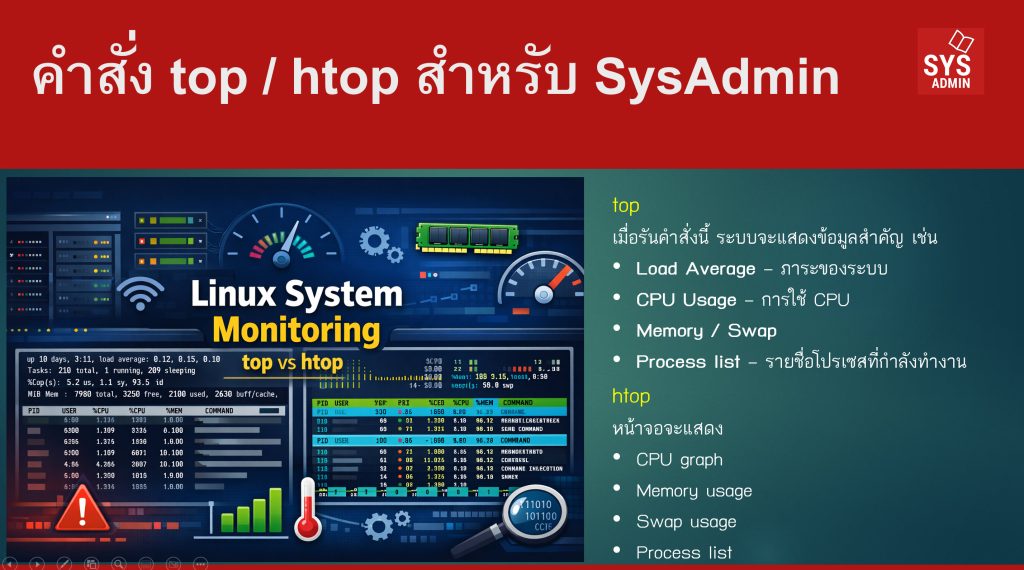
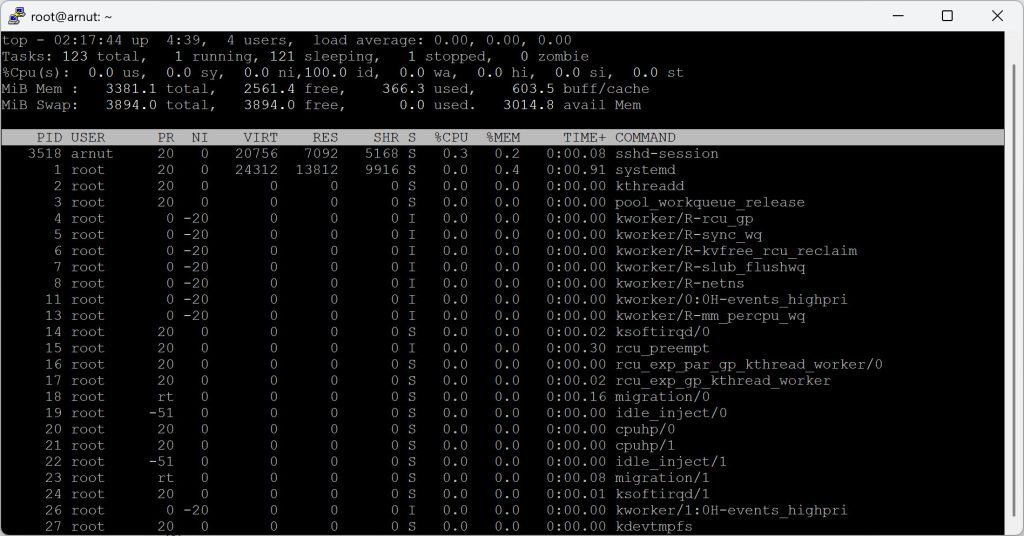
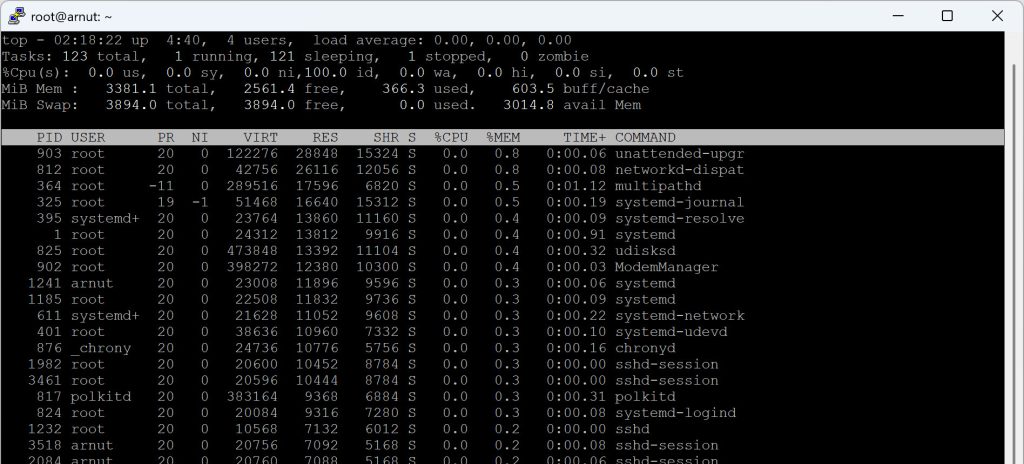
สำหรับผู้ดูแลระบบ (SysAdmin) บน Linux การตรวจสอบการทำงานของระบบแบบ Real-time เป็นสิ่งสำคัญมาก โดยเครื่องมือที่นิยมใช้มากที่สุดคือ top และ htop ซึ่งช่วยให้เห็นสถานะ CPU, Memory, Process, Load Average และการใช้ทรัพยากรของระบบ ได้ทันทีผ่าน Terminal
ด้านล่างคือคำอธิบายและคำสั่งสำคัญที่ SysAdmin ควรรู้
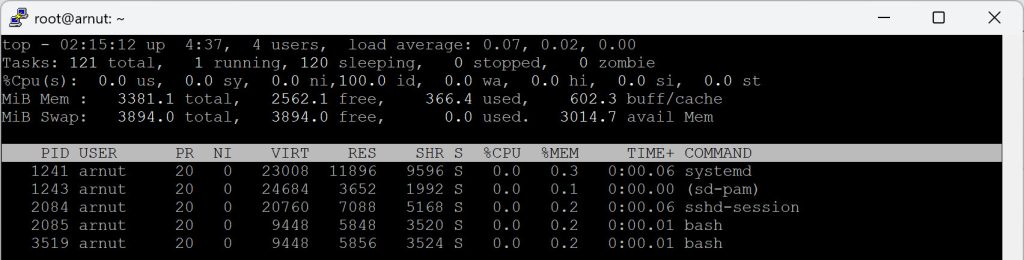
1. คำสั่ง top (พื้นฐานที่มีใน Linux ทุกเครื่อง)
top เป็นเครื่องมือมาตรฐานที่ติดตั้งมาพร้อมกับ Linux เกือบทุก Distribution เช่น Ubuntu, Rocky Linux, Debian
เรียกใช้งาน
เมื่อรันคำสั่งนี้ ระบบจะแสดงข้อมูลสำคัญ เช่น
- Load Average – ภาระของระบบ
- CPU Usage – การใช้ CPU
- Memory / Swap
- Process list – รายชื่อโปรเซสที่กำลังทำงาน
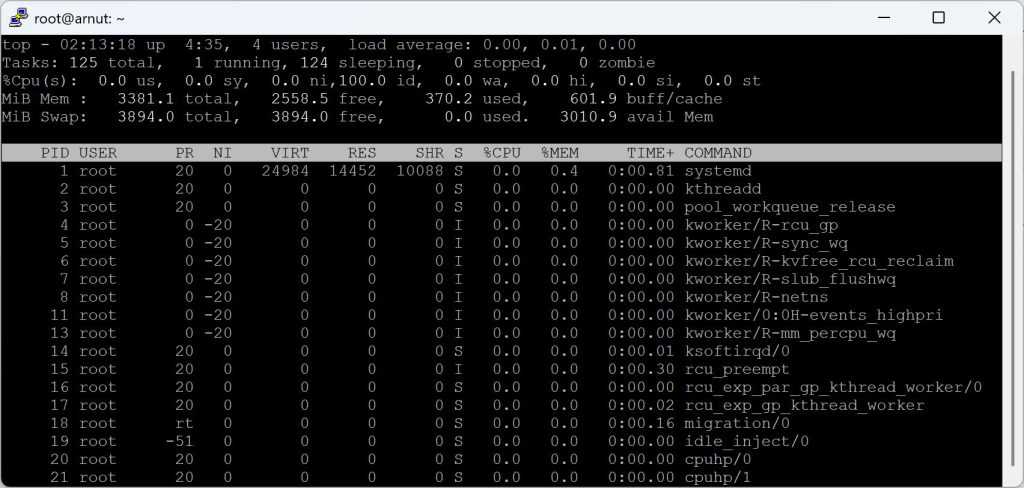
ตัวอย่างหน้าจอ top
Tasks: 125 total, 1 running, 124 sleeping, 0 stopped, 0 zombie
%Cpu(s): 0.0 us, 0.0 sy, 0.0 ni, 99.8 id, 0.0 wa, 0.0 hi, 0.2 si, 0.0 st
MiB Mem : 3381.1 total, 2558.5 free, 370.2 used, 601.9 buff/cache
MiB Swap: 3894.0 total, 3894.0 free, 0.0 used. 3010.9 avail Mem
ปุ่มที่ใช้บ่อยใน top
| ปุ่ม | ความหมาย |
|---|---|
| q | ออกจากโปรแกรม |
| k | kill process |
| P | sort ตาม CPU |
| M | sort ตาม Memory |
| T | sort ตาม CPU time |
| 1 | แสดง CPU ทุก core |
| c | แสดง command เต็ม |
ตัวอย่างการ kill process
ดู process ของ user เฉพาะ
refresh ทุก 2 วินาที
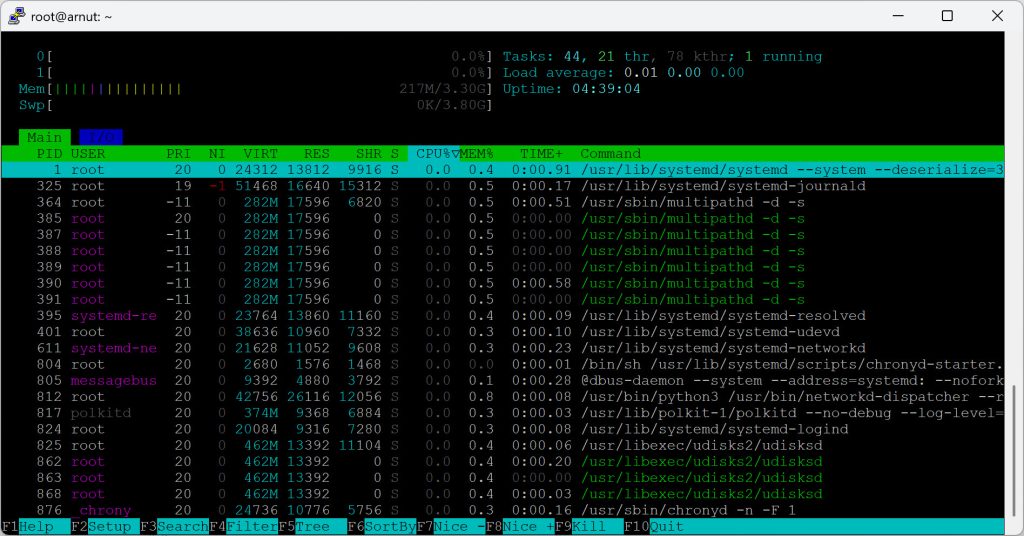
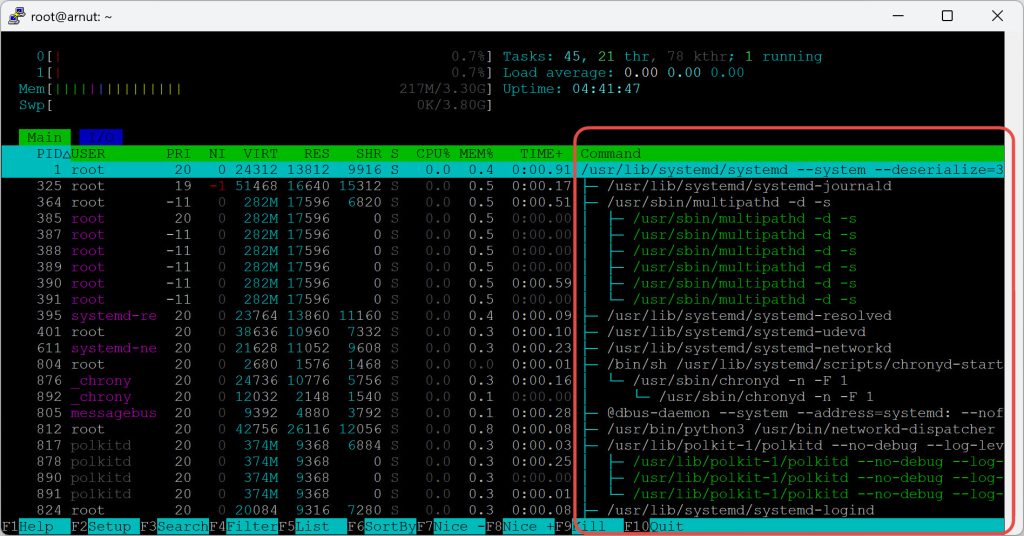
2. คำสั่ง htop (เวอร์ชันที่ใช้งานง่ายกว่า)
htop เป็นเวอร์ชันที่พัฒนาให้ใช้งานสะดวกกว่า top
ข้อดี
- มี สีสันอ่านง่าย
- ใช้ mouse ได้
- เลื่อนดู process ได้
- kill process ง่ายกว่า
ติดตั้ง htop
– Ubuntu / Debian
– Rocky Linux / RHEL
เรียกใช้งาน
หน้าจอจะแสดง
- CPU graph
- Memory usage
- Swap usage
- Process list
ปุ่มสำคัญใน htop
| ปุ่ม | ความหมาย |
|---|---|
| F3 | ค้นหา process |
| F4 | filter process |
| F5 | tree view |
| F6 | sort |
| F9 | kill process |
| F10 | exit |
ตัวอย่าง kill process ด้วย htop
- เลือก process
- กด F9
- เลือก signal เช่น
SIGTERMหรือSIGKILL
3. เทคนิคที่ SysAdmin ใช้จริง
ดู process ที่ใช้ CPU สูงสุด
ดู process ที่ใช้ RAM สูง
ดู process แบบ Tree
แล้วกด F5
ดูเฉพาะ process ของ service
เช่น nginx
4. เปรียบเทียบ top vs htop
| Feature | top | htop |
|---|---|---|
| ติดตั้งมาในระบบ | ✔ | ❌ |
| UI สวยงาม | ❌ | ✔ |
| ใช้ mouse ได้ | ❌ | ✔ |
| scroll process | ❌ | ✔ |
| tree process | ❌ | ✔ |
สรุป
top→ มีในทุกเครื่อง เหมาะกับ Server ขั้นพื้นฐานhtop→ เหมาะกับ SysAdmin ที่ต้องการดูระบบง่ายขึ้น
5. เครื่องมือขั้นสูงที่ SysAdmin ใช้เพิ่ม
นอกจาก top และ htop แล้ว ยังมีเครื่องมืออื่น เช่น
| Tool | ใช้ทำอะไร |
|---|---|
atop |
monitoring ละเอียด |
glances |
dashboard system |
nmon |
performance monitoring |
bpytop |
UI สวยมาก |
✅ สรุป
สำหรับ SysAdmin การใช้ top และ htop เป็นทักษะพื้นฐานที่ต้องมี เพราะช่วยให้ตรวจสอบปัญหา เช่น
- Server ช้า
- CPU ใช้สูง
- Memory เต็ม
- Process ทำงานผิดปกติ
ได้แบบ Real-time